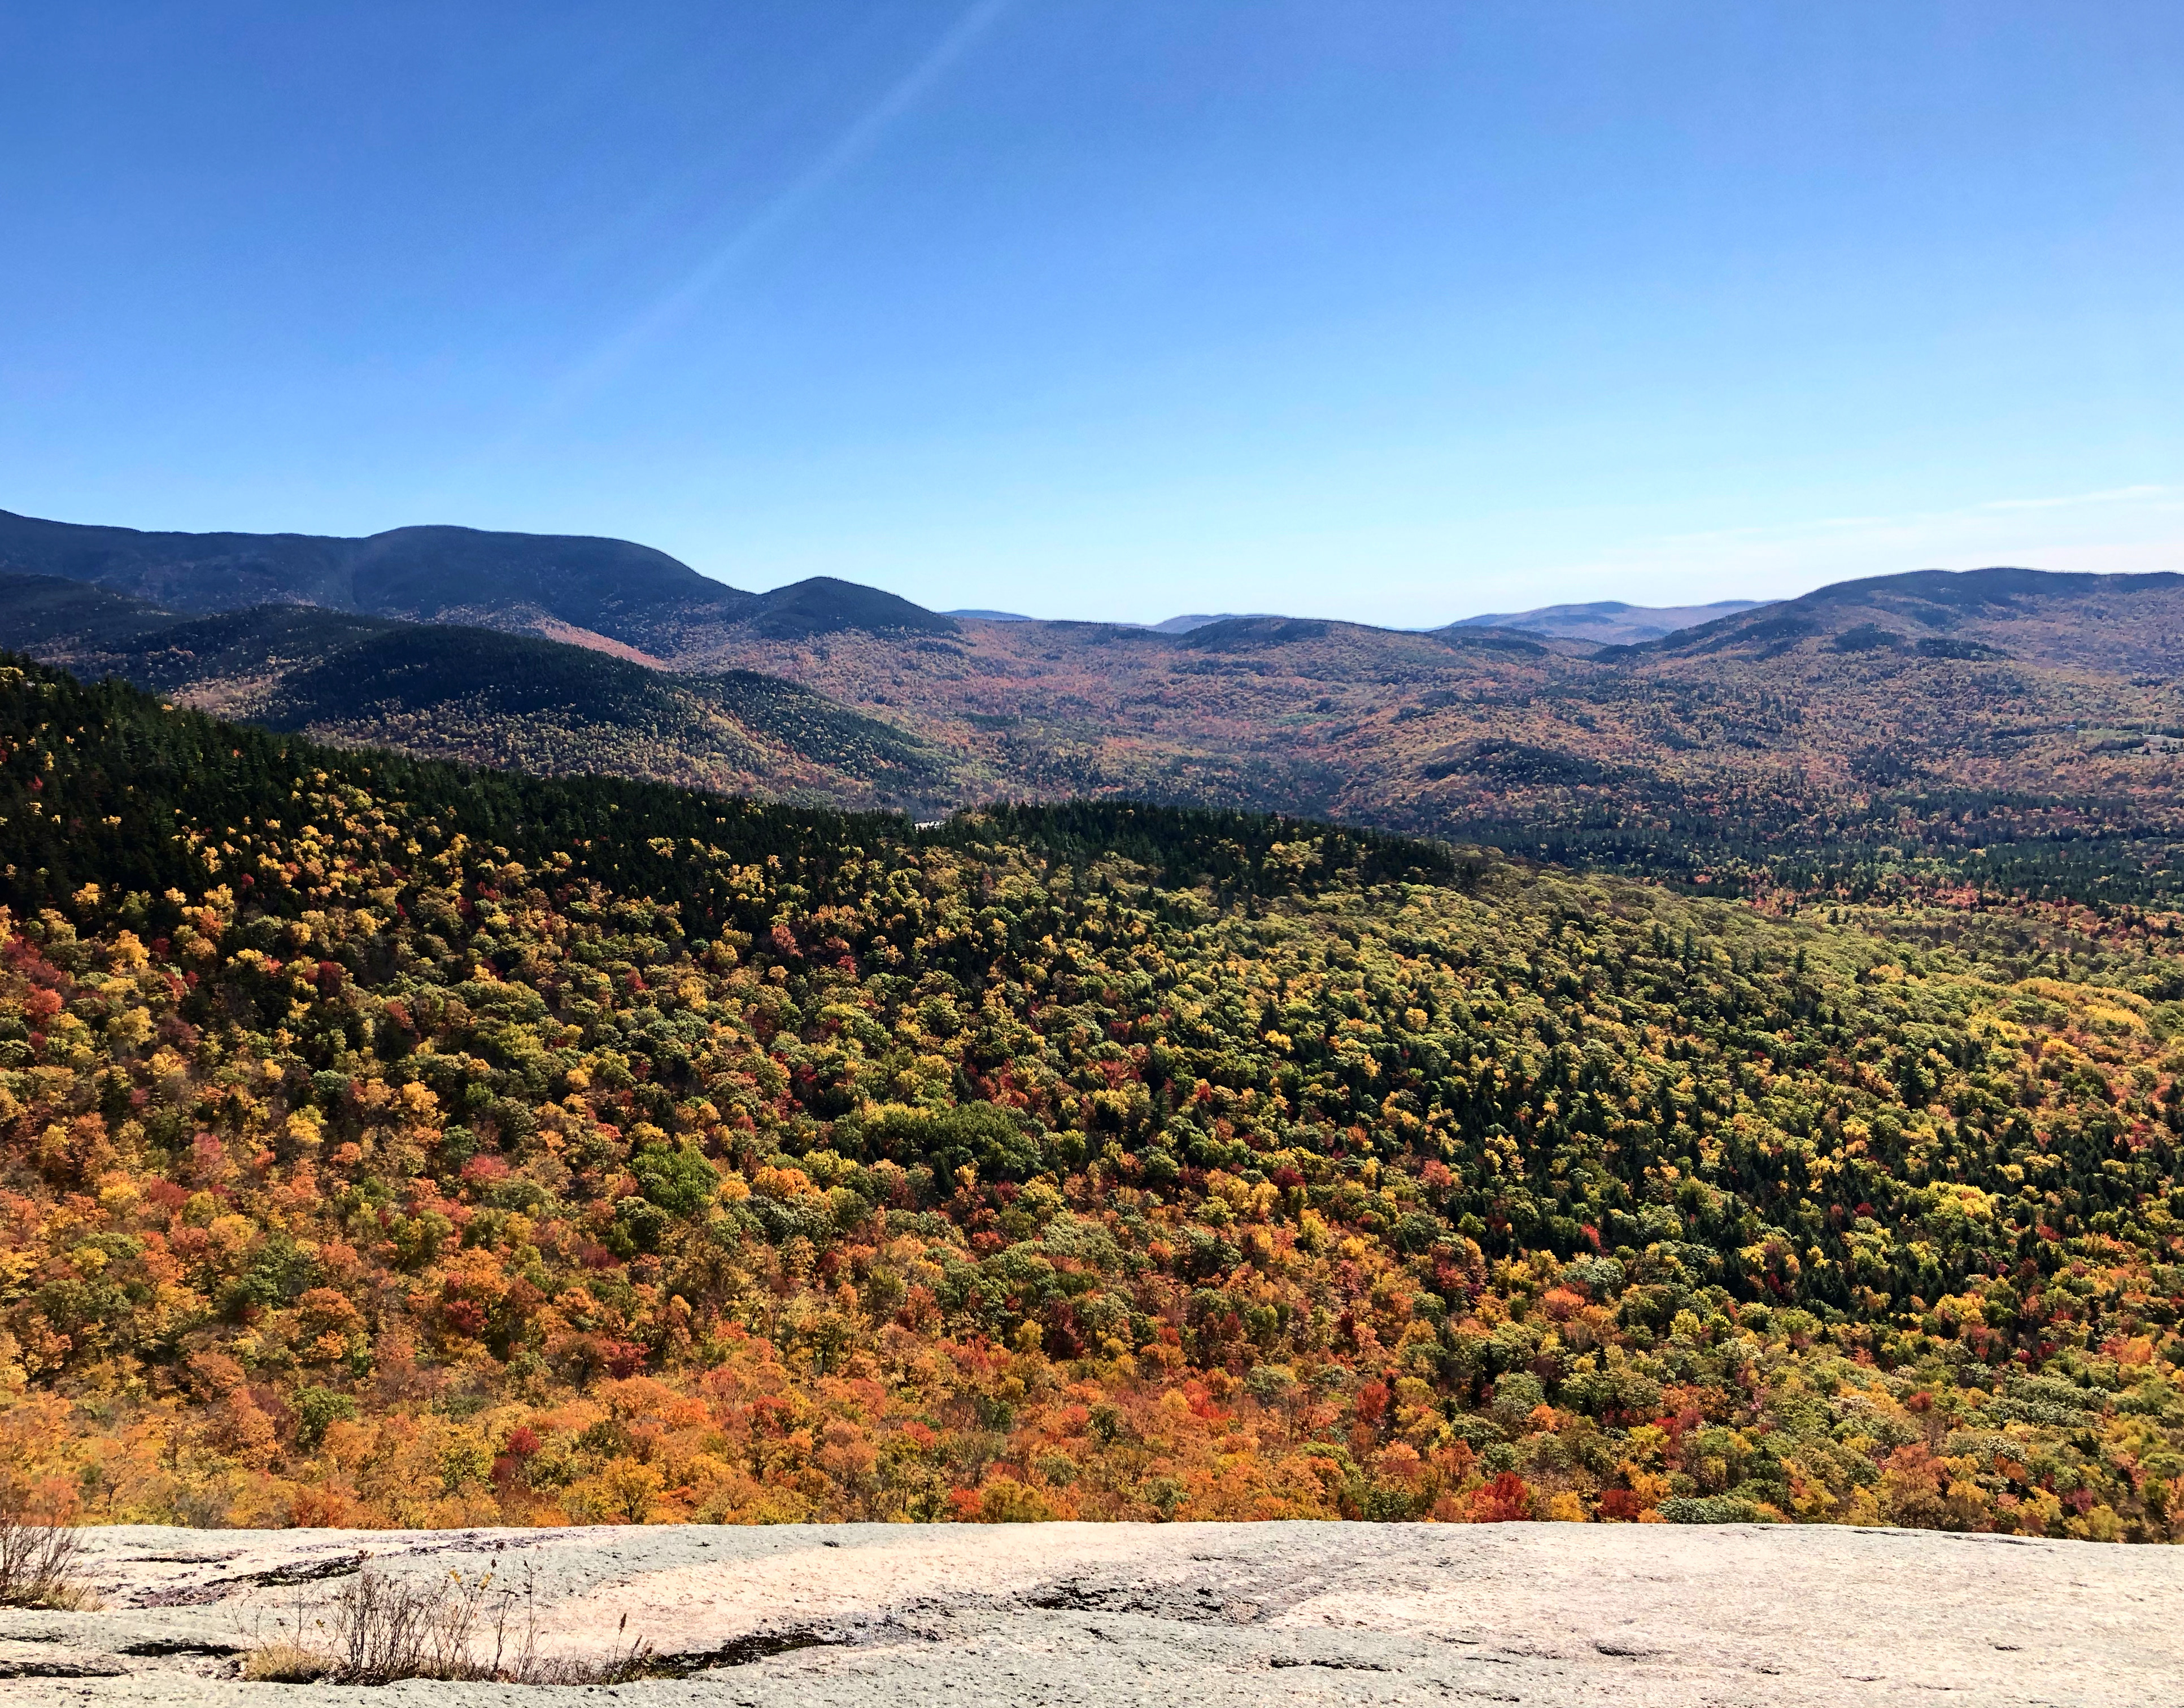
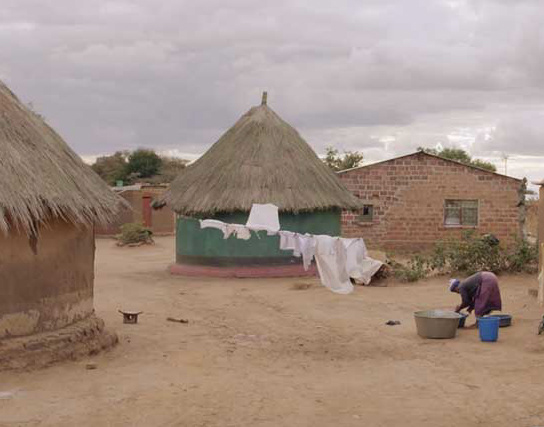
2023 & 24 have been climate-eye-popping as records are falling all over the planet.
Beyond home-based changes, (solar panels, driving an EV, reduction of single-use plastics) I'm creating informative, short, social videos based on scientific facts designed to inform and engage.
Beyond home-based changes, (solar panels, driving an EV, reduction of single-use plastics) I'm creating informative, short, social videos based on scientific facts designed to inform and engage.
These calls to action are my way of doing what I can. The work drives to a site from the University of Reading where Ed Hawkins has created visual storytelling showing the world's heating. A place where you can #ShowYourStripes
Visit my Vimeo page and share/download/educate. https://vimeo.com/showcase/10512394
Visit my Vimeo page and share/download/educate. https://vimeo.com/showcase/10512394
Doug Gould: CD/AD/CW/Editor
Credits for data visualization: Graphics and lead scientist: Ed Hawkins, National Centre for Atmospheric Science, UoR. Data: Berkeley Earth, NOAA, UK Met Office, MeteoSwiss, DWD, SMHI, UoR & ZAMG
Below is a glimpse of Global Sea Surface Temps as of 2/27/24. When the ice melts, the sea will rise. When the ocean heats, coral will die, and the ocean-born food web will suffer along with it. It's already happening.


